
22 Sep, 2026
•
9 MIN READ
How to Build Dashboards and Apps Inside a Multiplayer AI Thread
Key Takeaways
- A multiplayer AI thread is a persistent, multiplayer conversation. Everyone types into the same thread, so the whole team sees the same plan, code, and finished dashboard develop together instead of waiting on one person's recap.
- The AI proposes a plan before running anything. That checkpoint means your team approves the queries and chart choices before code executes, not after something already looks off.
- Connecting data doesn't require SQL. A semantic layer translates plain language like "monthly churn" into the correct joins and calculations, so the term means the same thing across every dashboard your team builds.
- The same thread that builds a dashboard can build an app. Chat commands that adjust a chart also work to add a form field or a new view, so you're not switching tools between reporting and building.
How to Build Dashboards and Apps in a Multiplayer AI Thread
Step 1: Open a Thread and State Your Goal Clearly
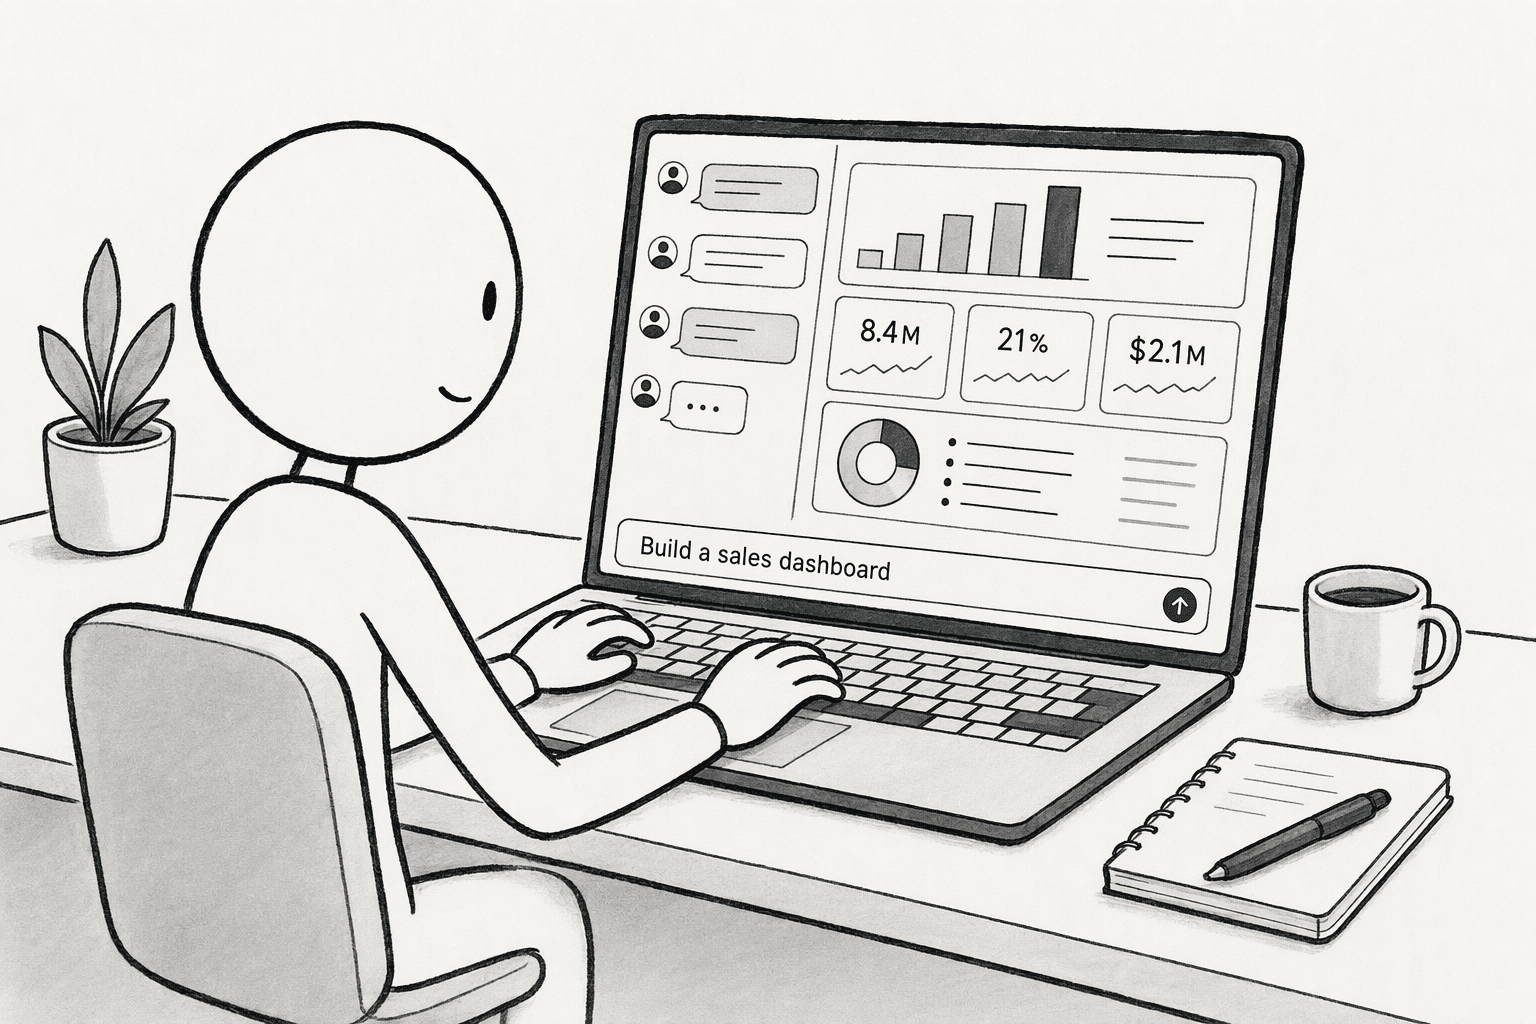
- Name the specific metric, chart, or report you want, not just the general topic.
- Mention the data source if you already know it, so the AI doesn't have to guess.
- Invite your teammates into the thread immediately, before you get a response, so nobody needs a separate recap later.
Step 2: Connect Your Data Sources
- Skip writing a schema by hand. Let it map business terms like "churn" or "win rate" to the correct fields on its own.
- Stop re-defining metrics per department. Let one definition apply across every dashboard your team builds afterward.
- Ask your first question in plain language as soon as the connection is live, you don't need to pre-build a data model first.
Step 3: Review the Plan Before Anything Runs
| Planning dimension | What it covers | What to check |
|---|---|---|
| Data queries | Tables, joins, filters for each tile | Confirm "Q3" and the fiscal calendar match what your team actually uses |
| Transformations | Grouping logic, derived metrics like win rate | Catch a wrong calculation while it's still in plain language |
| Visualizations | Chart types and layout | Swap a line chart for a bar chart by commenting, don't touch a config panel |
| Execution sequence | Order and dependencies between steps | Flag where one query feeds another if the order looks wrong |
Step 4: Let the Sandbox Run It, and Verify the Guardrails
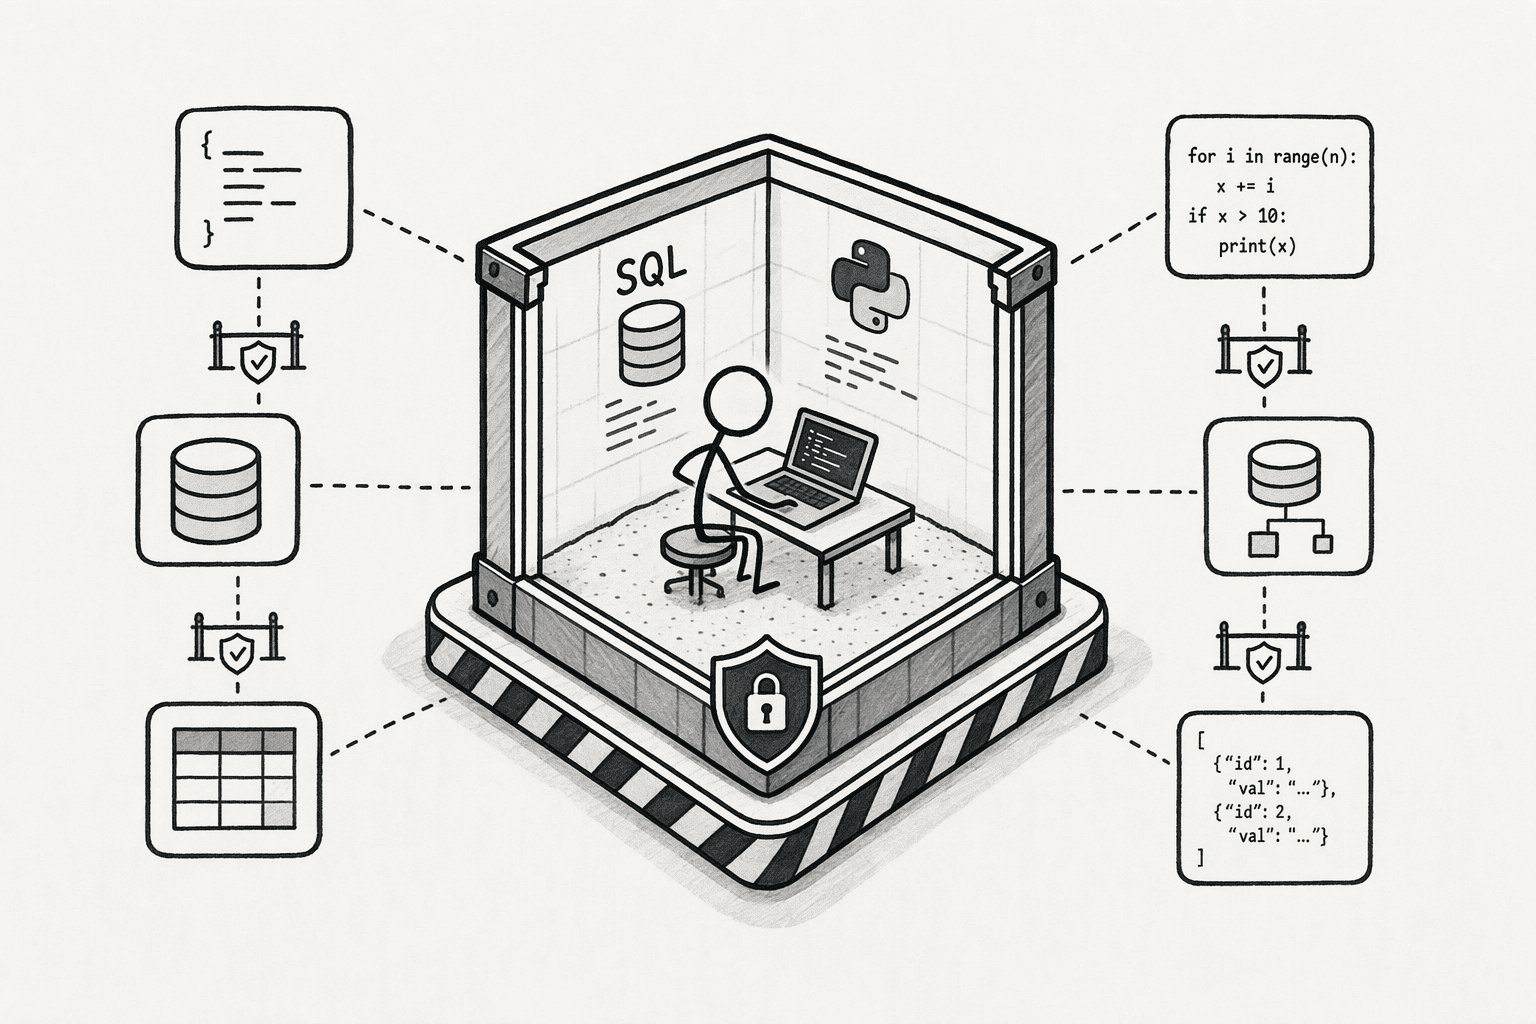
- Check that code execution stays separate from your infrastructure, so a bad query can't reach outside its own workspace.
- Verify permissions apply per person, not per shared login. The AI should act with your individual access level, so it can't surface data to a teammate who isn't cleared to see it.
- Use the thread's history to trace back exactly how a number was produced, even weeks later, instead of taking a chart at face value.
Step 5: Refine the Dashboard, or Build an App, With Chat Commands
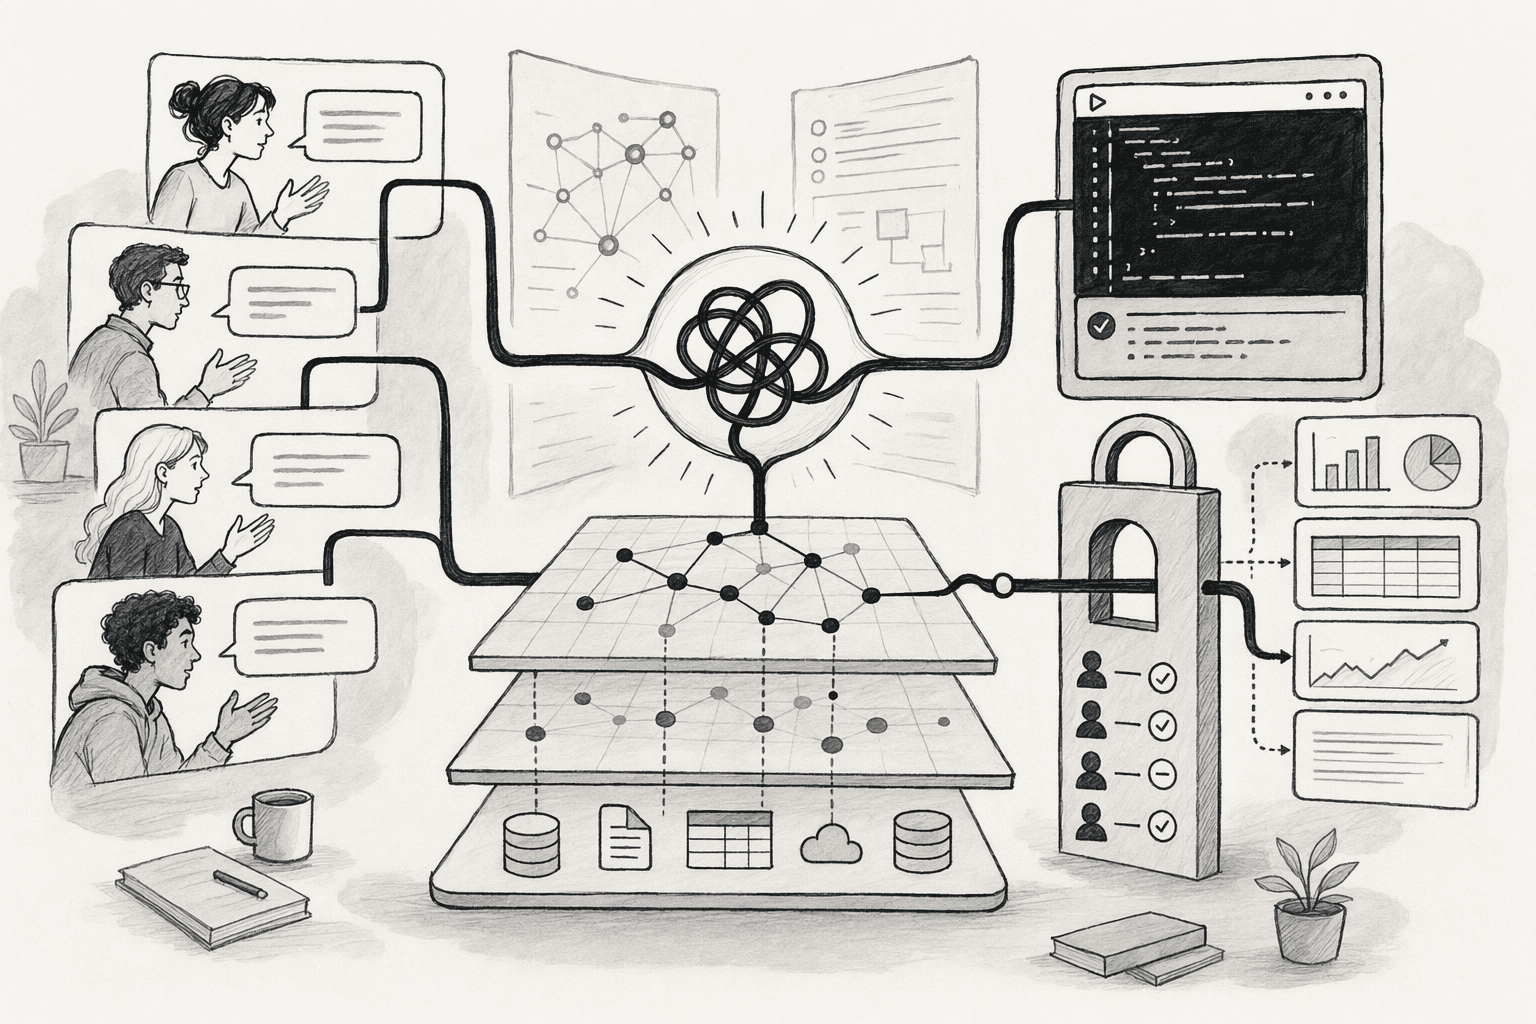
- Ask the thread to add a form field, a simple input view, or a small internal tool, the same plan-and-sandbox process applies.
- Keep every instruction specific: name the exact field, chart type, or grouping you want changed.
- Fix a wrong metric definition in the thread itself the moment you spot it, so the correction carries forward automatically.
Step 6: Set Access Levels and Share the Result
- Set role-based access down to the row or column level, so a rep sees only their territory while leadership sees the full picture, without building separate permission logic yourself.
- Share the link directly, or embed it where your team already works.
- Confirm access with a couple of stakeholders in the thread itself before wide distribution, skip the separate sign-off email chain.
Step 7: Keep the Thread Alive Instead of Letting It Go Stale
- @-mention the agent directly inside Slack or Teams the next time a related question comes up, instead of starting a new dashboard from zero.
- Make every correction in the thread itself the moment you catch an error, so it's captured for the next person who asks a related question.
- Revisit the thread when the underlying data shifts significantly, rather than waiting for someone to notice the dashboard looks wrong.
How PromptQL Solves Collaborative Dashboard and App Building
- Multiplayer by design: Threads support your whole team at once, not one user at a time, so the plan, the code, and the finished output are visible to everyone from the first message.
- No manual data modeling: The Agentic Semantic Layer profiles your existing databases and warehouse tables and works out the relationships needed to answer plain-language questions.
- Plan-first, not text-first: PromptQL writes and runs real code against your data rather than generating a fluent-sounding answer that only looks correct.
- Permissions that follow the person: Access is enforced per individual user at the data layer, so the same dashboard can show different data to different viewers automatically.
- Built to sit where your team already works: Tag it directly inside Slack or Microsoft Teams, and pick any model, frontier or open-weight, for the task at hand.
Conclusion
Frequently Asked Questions
What are multiplayer AI threads and how do they enable collaborative dashboard and app building?
How does PromptQL's plan-based execution and secure sandbox support building reliable dashboards from a conversation?
What is the step-by-step process for creating and iterating on a dashboard inside a PromptQL thread?
- Open a thread with a natural-language request like "Create a Q3 sales dashboard."
- Connect data through the Agentic Semantic Layer.
- Review the AI's structured plan and approve execution inside the sandbox.
- Iterate conversationally with commands like "Group by region."
- Embed the finished dashboard with role-based permissions.
- Configure agentic subscription alerts so the dashboard updates and notifies proactively.
How does an 'Agentic Semantic Layer' connect to company data to power thread-built dashboards without SQL?
What security, governance, and permissions models apply when multiple users build apps in a multiplayer AI thread?
What are the limitations of building dashboards inside an AI thread compared to traditional BI tools?
Sources
- The world's first multiplayer AI coworker you can @-tag in Microsoft Teams. - promptql.io
- PromptQL Tag | The company-wide AI agent for your workspace - promptql.io
- PromptQL | Multiplayer AI SDK - promptql.io
- Salesforce unpacks the architecture for the Agentic Enterprise - Salesforce - www.salesforce.com
- Multimodal, Semantic, and Agentic Enterprise Data is the Future - www.forrester.com
- Code Execution | Gemini Enterprise Agent Platform | Google Cloud Documentation - docs.cloud.google.com