Introduction
Imagine a critical product launch starts derailing in Slack. A dozen people are furiously typing past each other, burying the actual problem under a mountain of speculation. Nobody can see the forest for the trees.
The raw material for a solution is all there, tribal knowledge, system statuses, customer impact reports, but it is an unstructured firehose, impossible to action. A Slack channel is a stream of consciousness.
Turning that chaotic chatter into a data-driven decision surface is one of the most useful bridges you can build, and it no longer requires a data engineering team. What follows is a repeatable process for converting any threaded disaster into a governed, structured, and actionable dashboard that makes the signal impossible to ignore.
How Do You Convert a Slack Conversation Into a Dashboard?
You convert a Slack conversation into a dashboard in four moves: pick the channel and the decision the dashboard should support, get the messages out through a Slack export, the Slack API, or an integration, add structure such as sentiment or topic with an AI layer, and build the charts in a BI tool or an AI workspace.
With PromptQL Tag, you can also turn a Slack thread into a shareable dashboard, app, or deck, and it acts with each user's own permissions.
Key Takeaways
Converting a Slack conversation into a dashboard transforms raw narrative noise into a structured, quantitative asset that drives operational decisions. Here is the compressed blueprint:
- Define the exact data source and audience first: Scoping a specific Slack channel against a clear KPI, like response time or topic volume, prevents the most common failure point before any extraction occurs.
- Match the extraction method to your frequency and skill level: A one-off manual JSON export suits ad-hoc analysis. A custom Slack API pipeline provides automated customization but requires coding, while the Tableau App for Slack offers low-code notifications and threshold alerts with visual snapshots.
- Use an AI layer for unstructured text: An NLP layer converts free-form messages into dashboard-ready metrics like sentiment scores and named entities, which are hard to chart from raw JSON exports.
- Choose your output layer by how your team consumes the numbers: A BI tool you already use, Slack's own Surfaces, or an AI workspace thread like PromptQL Tag can each turn the structured data into a dashboard.
- Governance must mirror Slack's own permissions: Carry the user-authorization model forward, so a dashboard never shows data a user couldn't already see in the channel itself.
Step 1: Identify the Slack data source and define the dashboard's purpose
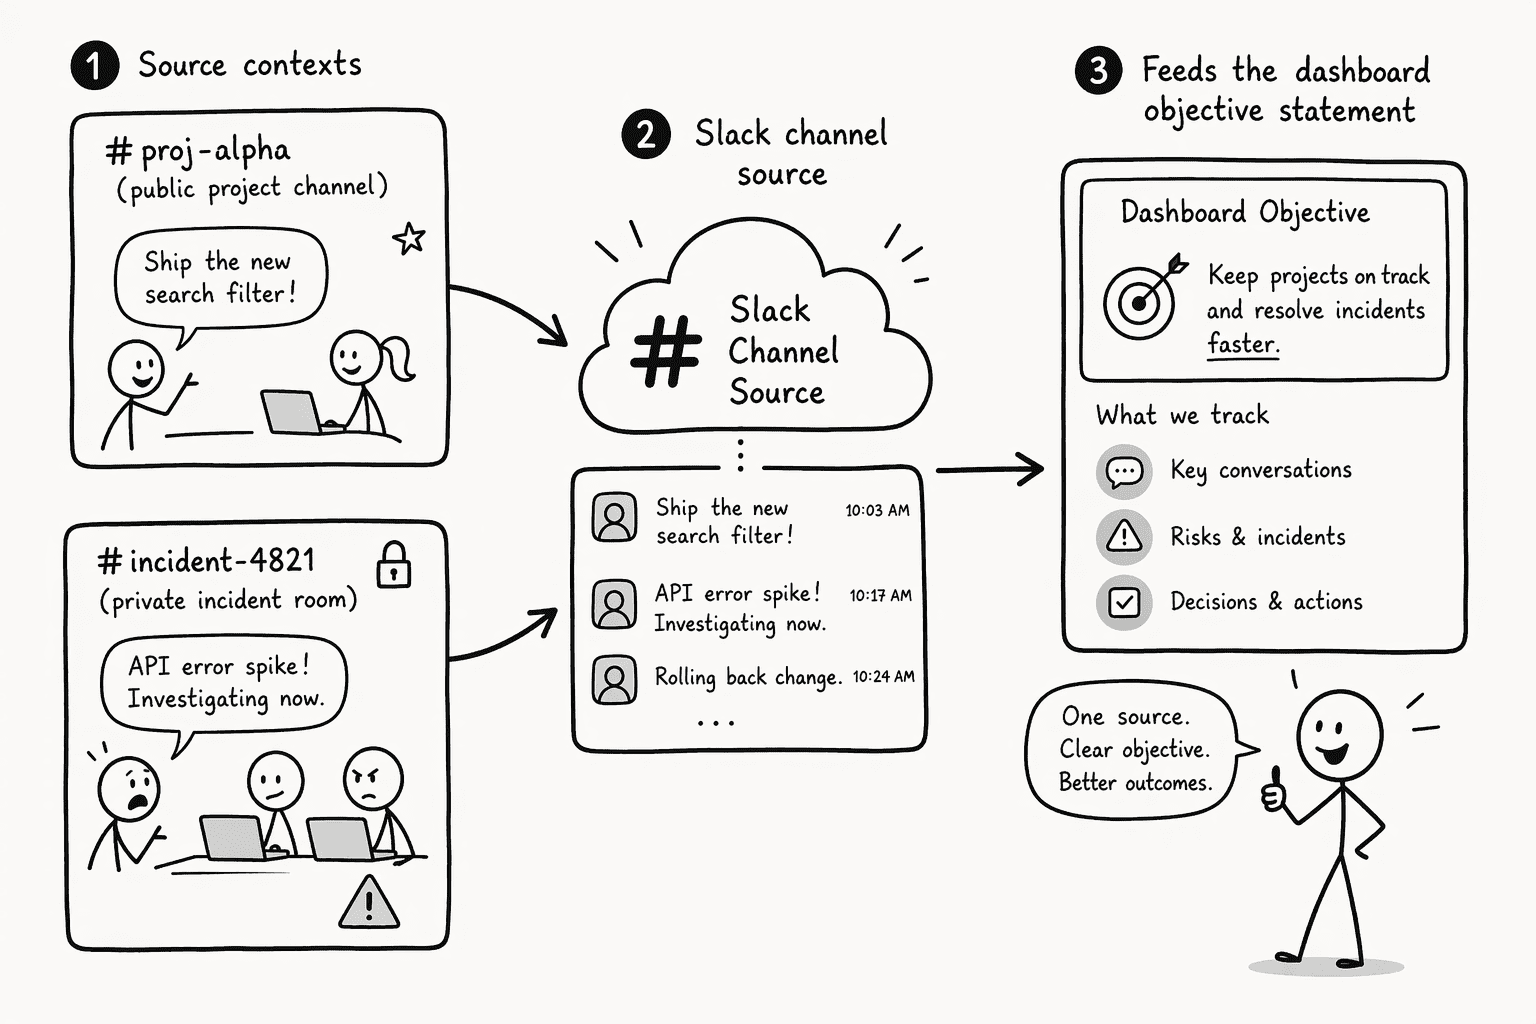
Skip the technical setup until you can answer one question in a single sentence: what decision will this dashboard unlock that the raw thread cannot? Without a specific, scoped objective, you end up with a vanity dashboard that counts messages but changes no behavior.
The source matters immensely here. A public project channel produces a very different stream than a private executive incident room.
Slack's native analytics surface some of this for you: if you are on a Business+ or Enterprise+ plan, Message activity analytics gives you a quick initial view of volume before you define a specific service-level KPI.
These are usage metrics, not an analysis of what people wrote, so treat them as a starting point.
Push past the volume play. A dashboard purpose might be "reduce average incident acknowledgment time from the #ops-alerts channel," which immediately defines your source (#ops-alerts), your key extraction need (timestamp of first reply), and your audience (the on-call manager).
You must also know whether you need structured, pre-built analytics, like Slack's analytics dashboard, which offers basic overview metrics on the Free plan, detailed tabs on Pro and Business+, and org-level dashboards on Enterprise, or a custom visualization that requires tapping the raw conversation body itself. That distinction directs every subsequent step.
Step 2: Choose the right extraction method, manual CSV, API, or native integration
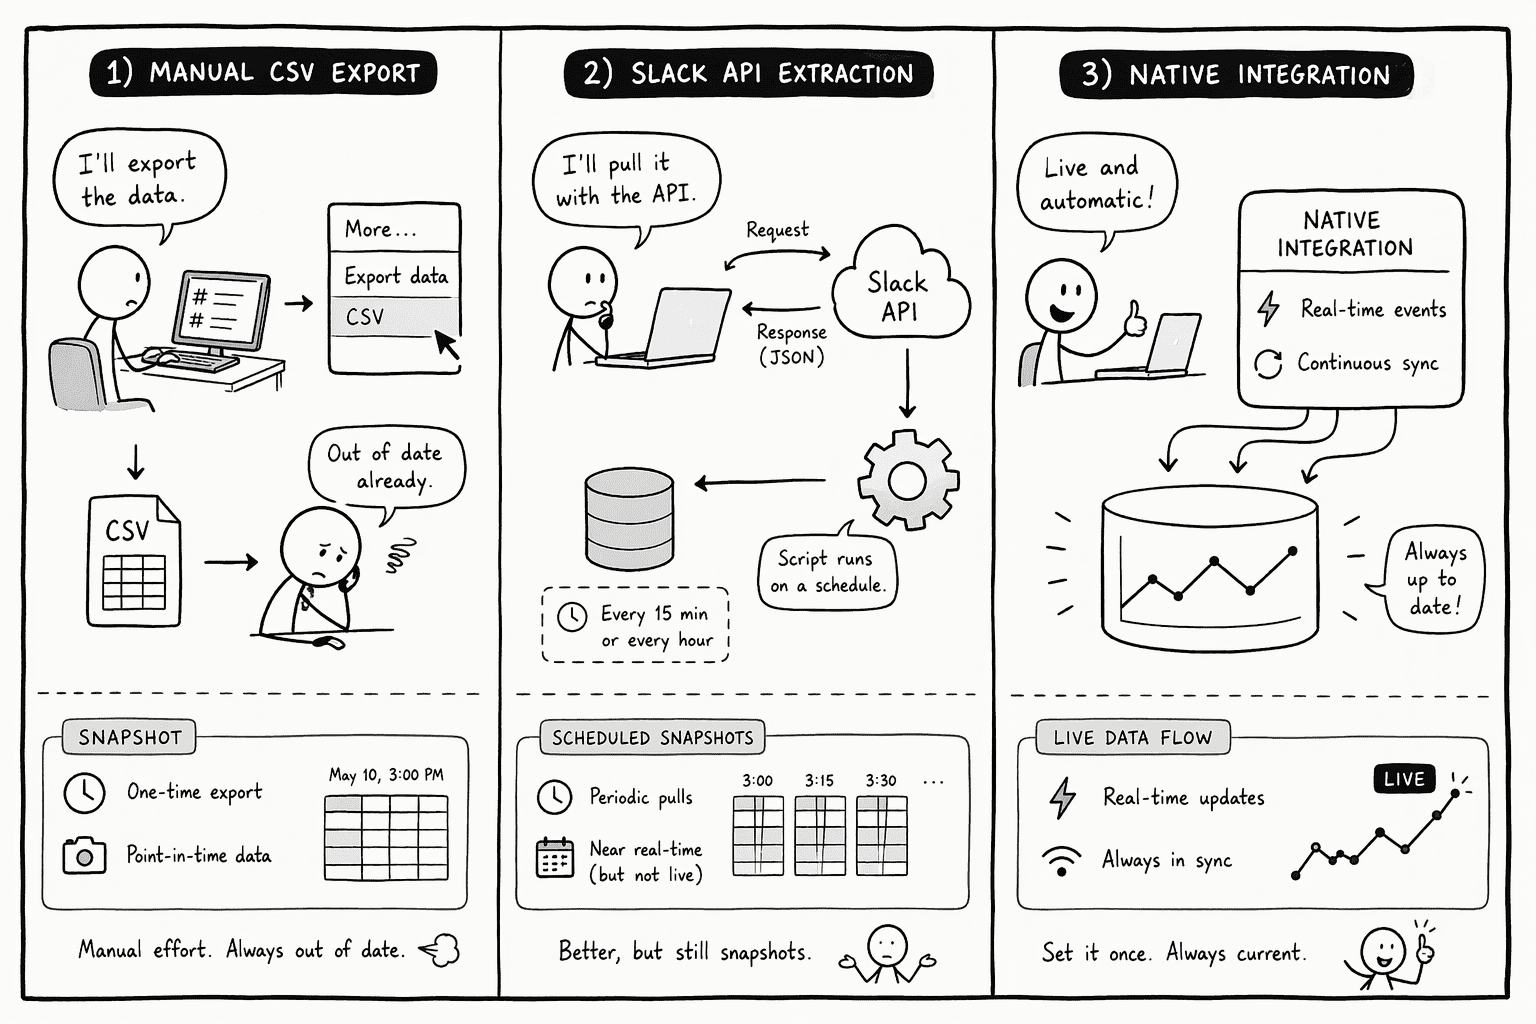
You have three real paths for getting Slack data out, and the right one depends entirely on how often the source data changes.
- Manual export. If you are analyzing a post-mortem thread that will never spark up again, stop over-engineering it. Ask a Workspace Owner to request an export (admins can export public channels) and open the JSON files. Slack exports messages and file links as JSON, and what you get depends on your plan. Free and Pro exports cover public channels only, while Business+ adds private channels and DMs after the Primary Owner approves. It is the quickest route to a one-time truth, but it freezes a snapshot that kills any hope of a live, breathing dashboard.
- Slack API. The alternative is a living integration. Piping data through the Slack API gives you the raw payload of each message: text, timestamps, and thread relationships delivered exactly when you need them. This is the only route if you plan to apply a custom sentiment model to the conversation text itself. You also have to manage rate limits and pagination yourself, and the limits depend on the kind of app. Under Slack's May 2025 change, commercially distributed apps that are not approved for the Slack Marketplace get 1 request per minute on
conversations.history and conversations.replies, with a maximum of 15 messages per request. That applies to new apps and new installs of existing apps. Internal customer-built apps are not affected and keep their higher limits. - Native integration. For teams that want structured data without managing their own connection logic, the Tableau App for Slack brings Tableau into Slack. It sends notifications, including data-driven alerts, which need Tableau 2021.3 or later and fire when a data threshold is met. Notifications can include a visual snapshot. Sharing and searching Tableau content from Slack are Tableau Cloud features.
Step 3: Structure unstructured conversations for dashboard metrics using AI/NLP
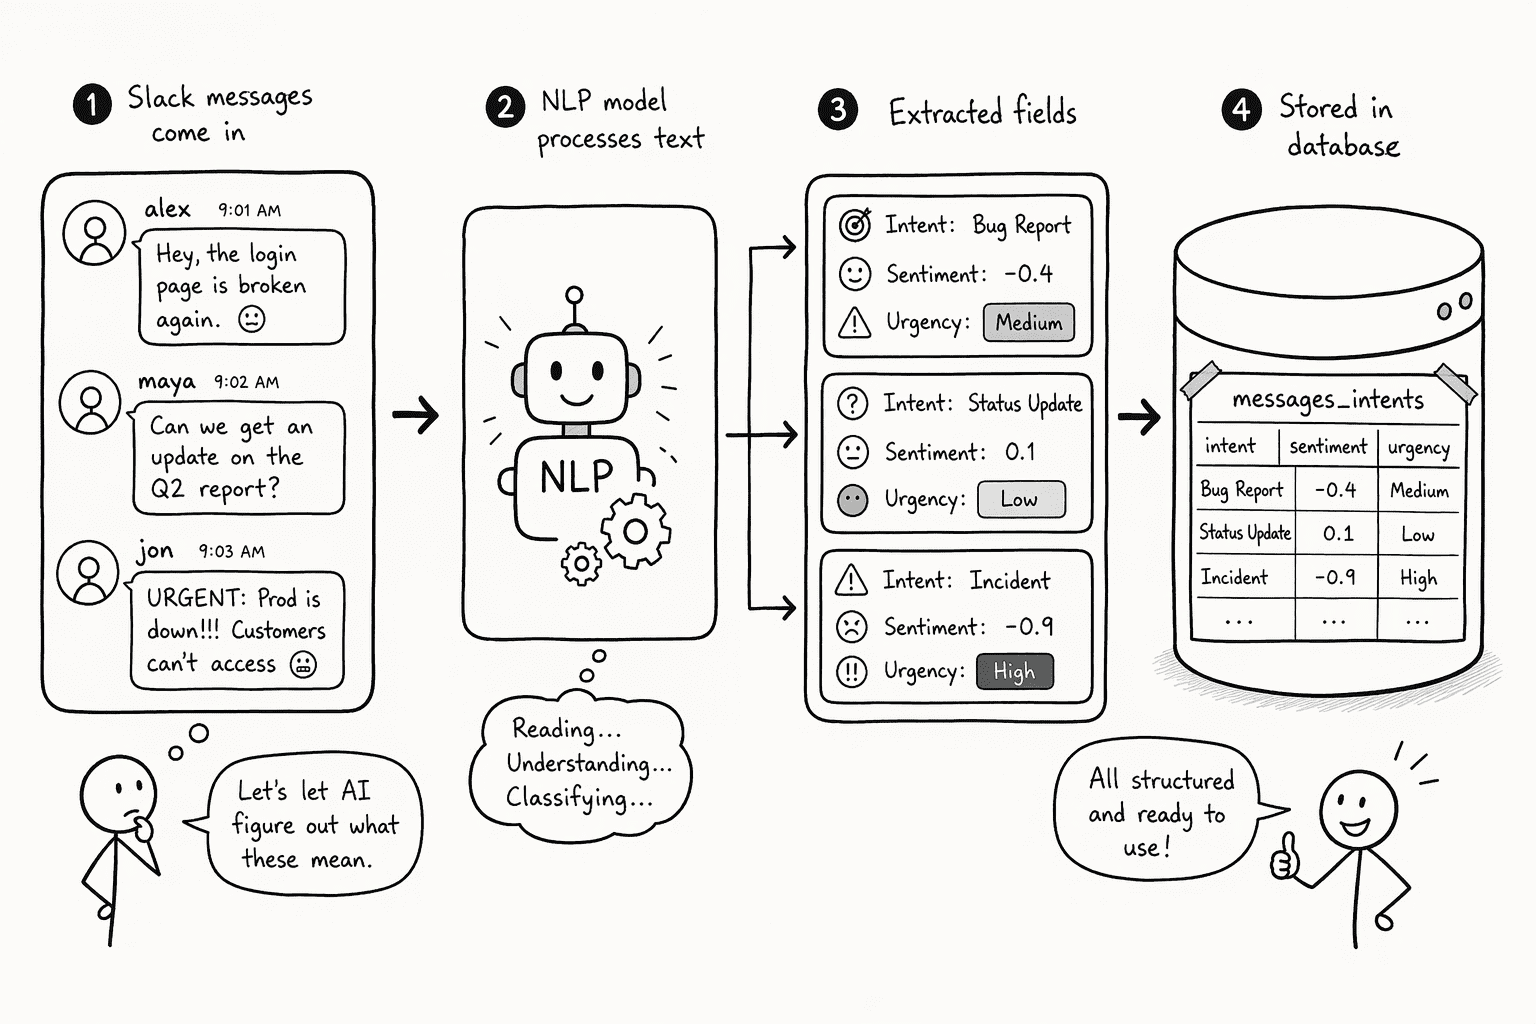
A dashboard filter cannot natively group messages by "refund request" or quantify that the sentiment in your #beta-feedback channel dropped overnight. You need an AI interpretive layer to pull the quantitative value out of the text.
- Custom API pipeline: Route each message through an NLP classification model. Write a script that annotates the incoming stream before it hits your database, tagging structured fields like intent, sentiment score, and urgency onto the original document.
- Transformed record: For example, instead of reading "This update is causing major latency," your database receives
sentiment: -0.7, intent: bug_report, entities: [update, latency], date: 2026-11-19T10:32:00Z. That enables a time-series chart of frustration spikes aligned with specific product releases. - Implementation: Use third-party cloud NLP pipelines or open-weight models on your own infrastructure if your organization restricts data leaving its VPC. Keep the labeling pipeline stateless, raw message in, enriched record out.
Step 4: Select a dashboarding platform and build the visual layer
Your enrichment pipeline from Step 3 is now pushing rows into a database, and that structured output defines which platform will best surface it. You have three options:
- A BI tool you already use. If your team already runs Tableau, the Tableau App for Slack can send threshold alerts with a visual snapshot to the people who need them.
- Slack's own Surfaces. Ask Slackbot to build a dashboard, report, or deck from a conversation.
- An AI workspace thread such as PromptQL Tag. PromptQL Tag turns a Slack thread into a shareable dashboard, app, or deck, and it acts with each user's permissions. The next step covers how it works.
Choose the option that matches how your team consumes the numbers: a recurring review, an alert, or a question asked in the thread.
Step 5: Implement auditable, AI-native automation with PromptQL's plan-based execution
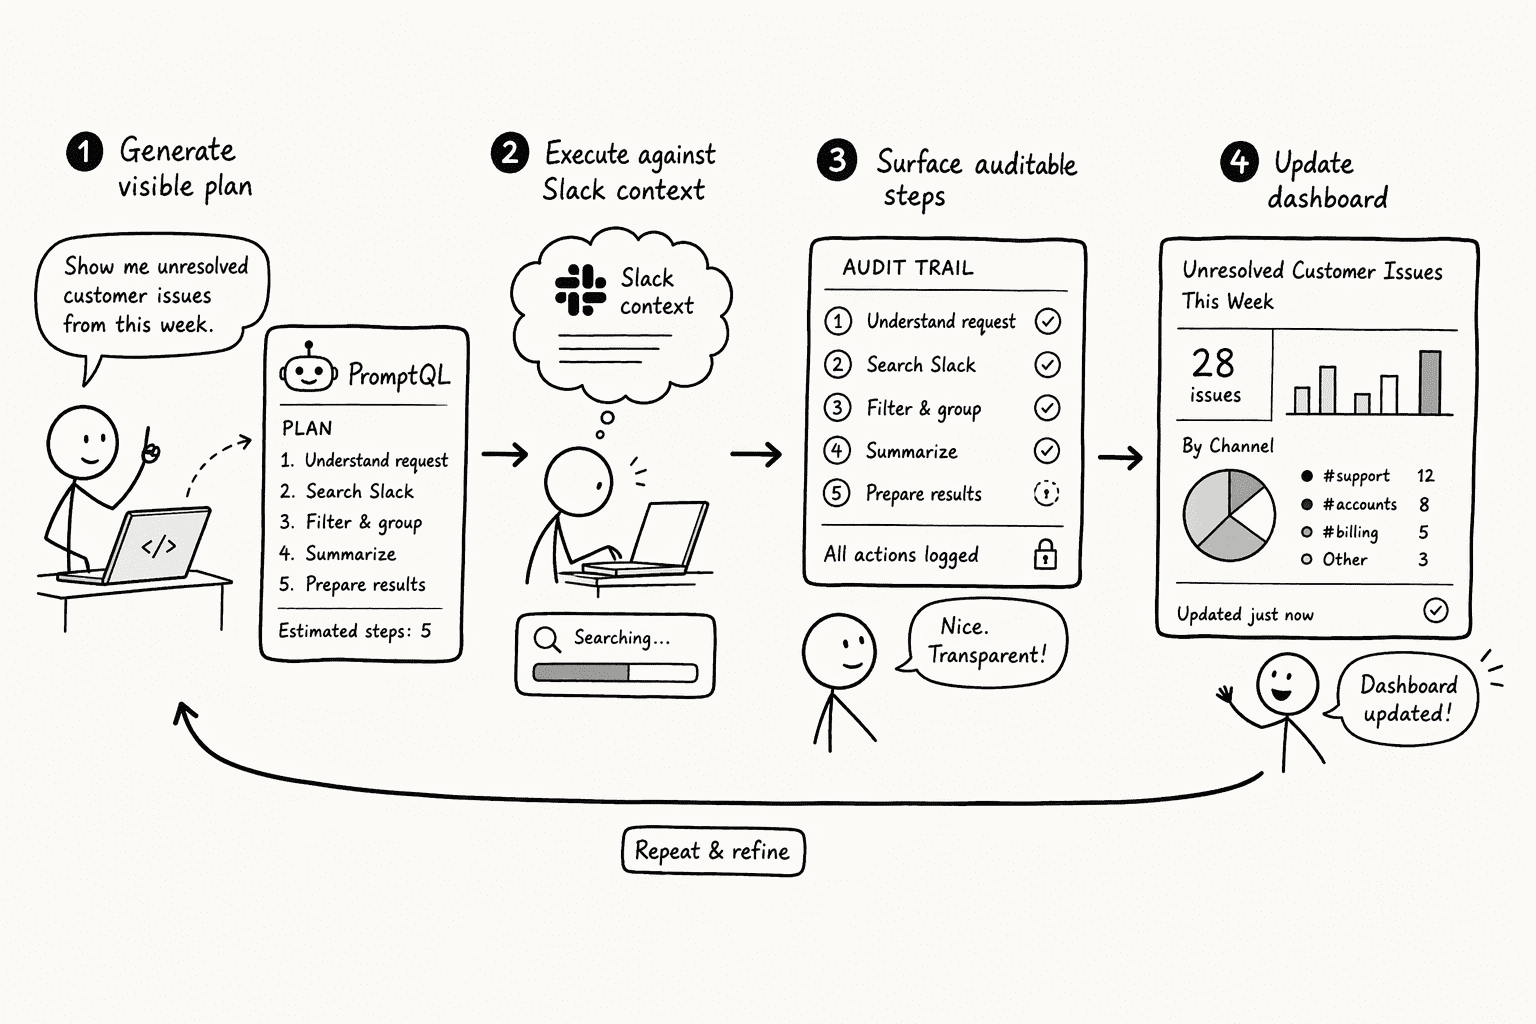
Brittle ETL scripts that silently fail or hallucinate during a Slack-to-dashboard transfer create a trust crisis the moment a CEO notices a spike looks wrong. One way to reduce that risk is plan-based execution, where the AI agent shows its approach before it touches your data. PromptQL Tag works this way, in a defined, sequential loop:
- Tag it in the thread. Mention PromptQL Tag in the Slack thread and describe the dashboard you want.
- Review the plan. Before anything runs, PromptQL shows its plan. For example, a plan might read: "1. Connect to #prod-incidents via API, 2. Filter for the last 72 hours of threaded replies, 3. Apply the standard sentiment model against those fields."
- Approve it. The plan needs your approval to move forward. This creates a review beat that lets you correct incorrect assumptions about channel membership before data moves.
- It runs with your permissions. PromptQL Tag acts with each user's permissions, so it cannot reach data the person who asked cannot reach.
- The code runs in a sandbox. The analysis code runs in an isolated WebAssembly sandbox.
- Save, share, and rerun. The result is a saved, named artifact you can share in the thread. Its permissions are enforced at the data layer and travel with it wherever it is shared. You can also ask it to rerun on a schedule, such as every Monday at 9am.
Because the plan is visible before it runs and the code runs in a sandbox, a number that looks wrong is easier to trace back to the step that produced it.
Step 6: Harden security, governance, and user-authorization into the pipeline
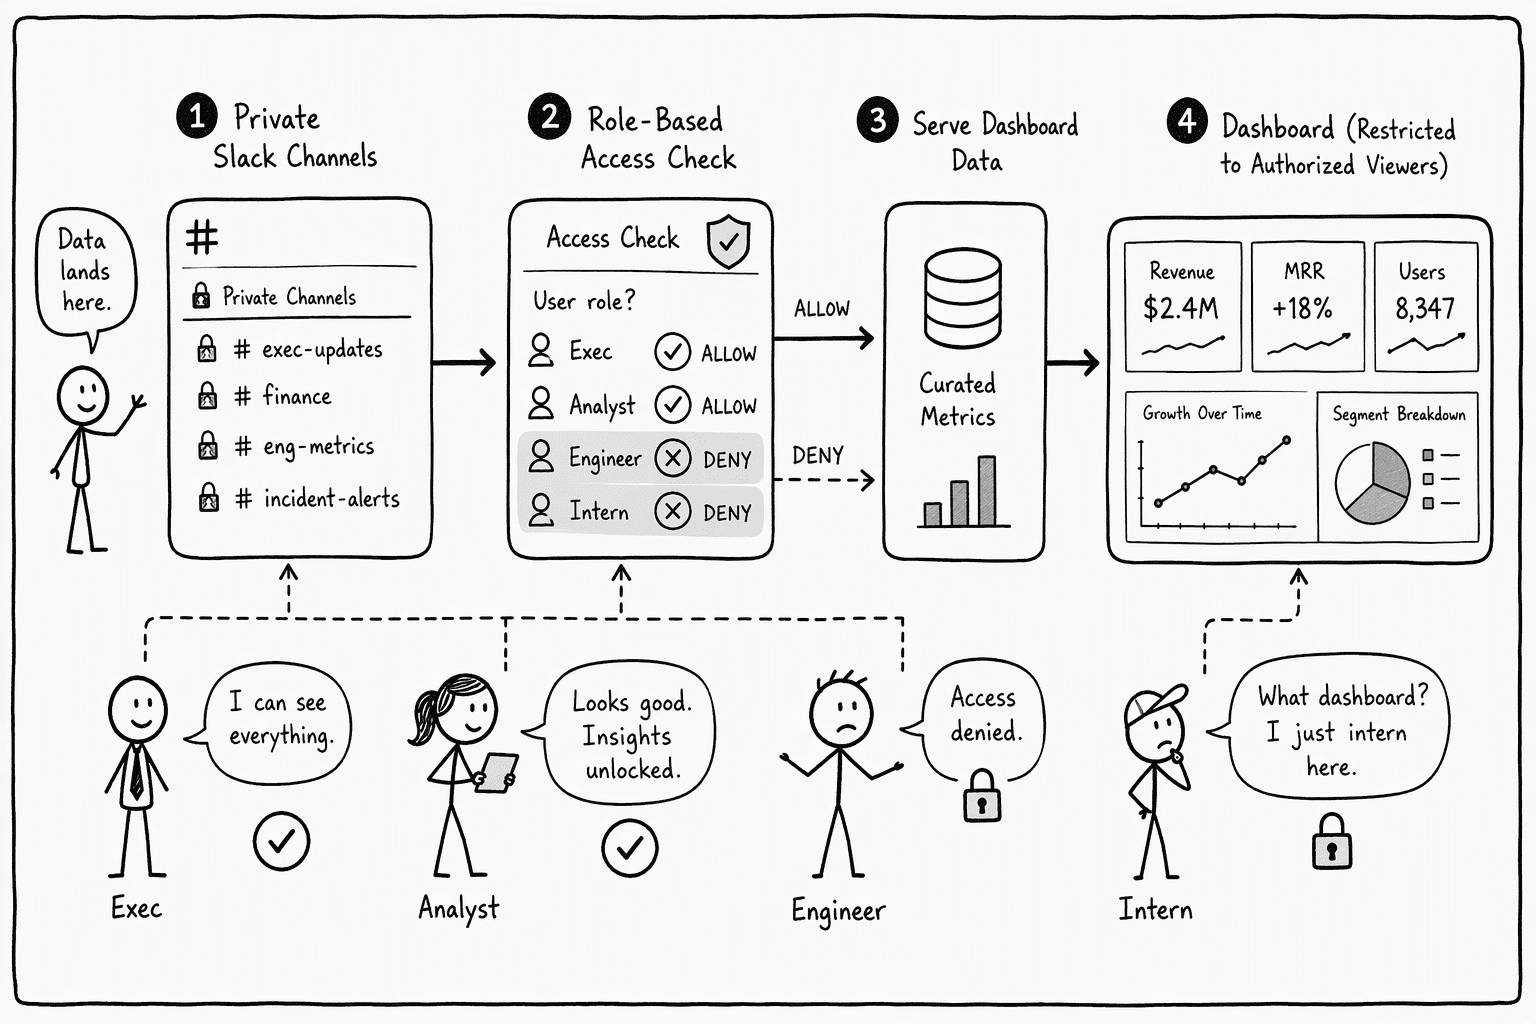
The moment Slack data leaves the chat client and enters a structured store, the company's implicit social boundaries around data must turn into strict programmatic rules.
The cardinal rule of a trustworthy Slack dashboard: a user should never be able to aggregate metrics from a private channel within a chart unless they can also open and read that private channel. Any AI-native approach should use a user-authorized model. The person viewing the dashboard becomes the limiting scope of the query. This closes the side door where a manager sees a consolidated "team sentiment score" that accidentally aggregates data from a sensitive HR channel they cannot access.
Start with Slack's own controls. By default, all members can view workspace analytics, but workspace and org owners can restrict access or disable member metrics on paid plans only. Set this before sharing anything externally. Then check how previews behave.
In Tableau, Share with Snapshot adds a preview that everyone you share it with can see, regardless of their access level, unless the content has filters that restrict data access, such as row-level security.
The complete package needs an audit trail. You need to know who pulled a trend report and which messages served as the source for that metric.
With PromptQL, the data plane, which holds conversation history, the wiki, metadata and indexes, can run in your own AWS, GCP, or Azure account with BYOC. Credentials are injected at runtime, so they are never exposed to the model. PromptQL Tag is also SOC 2.
Step 7: Publish, share, and iterate the dashboard within collaborative workflows
An operational dashboard dies a silent death if you force the team to leave Slack to look at it. The channel that created the need for the metric is the only surface where the metric will actually be acted upon. You close the loop by bringing the result back into the collaborative stream, and the exact mechanism depends on its origin.
- BI platform: Use data-driven alerts, available in Tableau 2021.3 and later. When your data crosses a threshold you set, the Tableau app sends a Slack notification that can include a visual snapshot.
- AI workspace thread: Share the PromptQL artifact in the same thread where the conversation started, and ask it to rerun on a schedule so the numbers stay current without rebuilding the dashboard by hand.
Conclusion
Turning a Slack thread into a dashboard compresses intelligence. The process pulls out what actually happened and how fast you fixed it, then arranges both into a structured record you can verify. Fear and speculation drop away because the thread already contains the ground truth.
Tools like PromptQL Tag now let you do this from inside the thread, with the plan visible before it runs and your existing access controls carried through.
The operational status view you wanted is already inside your chat history. You just have to execute the plan to get it out.
Frequently Asked Questions
What are the main methods to turn Slack messages into a dashboard, from manual exports to automated API integrations?
The primary paths are:
How do you extract and structure unstructured Slack conversations for dashboard metrics like sentiment, volume, or topic analysis?
You route raw message payloads through an NLP classification pipeline. This transforms conversational text into structured, quantitative fields by tagging each record with metadata like sentiment scores (-0.7), timestamps, intents (bug_report), and named entities before it ever hits a database, making the text chartable.
What tools, platforms, or AI-assisted approaches can connect Slack to business intelligence dashboards in 2026?
The approaches include:
What are the security, compliance, and data governance considerations when piping Slack data into a dashboard?
Dashboards must mirror Slack's access rules: a user should never read aggregated data from a channel they cannot access natively. Use Slack's controls to restrict analytics access or turn off member metrics on paid plans, check that shared snapshots respect row-level filters, and keep an audit trail of who ran what and which messages fed each metric.
What typical metrics or KPIs can you generate from Slack conversations for a team or project dashboard?
You can surface operational KPIs like mean time to acknowledgment through reply timestamps, product sentiment trends over time via text analysis, topic frequency and volume (support vs. feature requests), and action-item resolution rates by tracking thread closure status and reaction emoji using a parsed API feed.
How can an AI workspace with a user-authorized model and sandboxed execution make this process more reliable and auditable than traditional ETL pipelines?
PromptQL Tag shows its plan before it runs, needs your approval, and acts with each user's permissions, so every step is visible and access stays limited to what the person asking can already see. The code runs in a WebAssembly sandbox, so a number that looks wrong is easier to trace back to the step that produced it than in a brittle ETL script.
Sources
- Unlock Insights from Slack Usage Data and Analytics - Trailhead - trailhead.salesforce.com
- Slackforce Surfaces: Live Dashboards, Decks, and Reports in Slack | Slack - slack.com
- Use the Tableau App for Slack - Tableau - help.tableau.com